Avaaj Otalo (literally, “voice stoop”) is an interactive voice application for small-scale farmers in Gujarat, India. It provides farmers with access to relevant agricultural information and a virtual community of peers to share their knowledge with over the phone. By dialing a phone number and navigating through simple audio prompts, farmers can browse, listen to, and record agriculture-related information, as well as respond to questions.
This service was designed in 2008 as a collaboration project between the UC Berkeley School of Information, Stanford’s HCI Group, IBM India Research Laboratory, and Development Support Center – an NGO in Gujarat, India. The system has been “live” since 2010, serving the community of Gujarat farmers. Every time a farmer places a call, the system creates a record of important information about that call such as date and time, duration of the call, inquiry topic, selected forum, and crop that the call was about.
Avaaj Otalo researchers would like to have a visualization tool that can help them track and visually explore system log data. They can use this information to make improvements to the existing services and possibly expand the project scope to other regions in India. Thus, the main objective of our visualization is to allow the founders and the researchers of Avaaj Otalo to analyze and visually explore key metrics behind application usage.
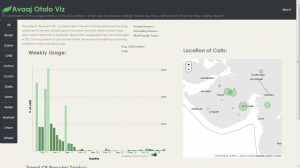
Our visualization focuses on providing insight into the trends and patterns of weekly call volumes. The bar chart displays weekly number of calls to the application over the course of a year. Color intensity indicates how average duration of the calls is related to call volume (darker colors signify longer calls). The map identifies the Gujarat’s villages that these calls are coming from. The small multiples on the bottom of the page exhibit call topic trends. Since all crops have very different seasonal and agricultural cycles, the visualization is organized by individual crop.
You can view our visualization here: http://priya-i.github.io/visualize-ao/
Team: Julia, Seema & Priya
