Police Shootings: A Closer Look at Unarmed Fatalities
By Anonymous
Last year, fifty-five people were killed by police shootings while “unarmed.” This number comes from the Washington Post dataset of fatal police shootings, which is aggregated by “local news reports, law enforcement websites and social media” as well as other independent databases. In this dataset, the recorded weapons that victims were armed with during the fatal encounter range from wasp spray to barstools. Here is a breakdown of the types of arms that were involved in the fatal police shootings of 2019.
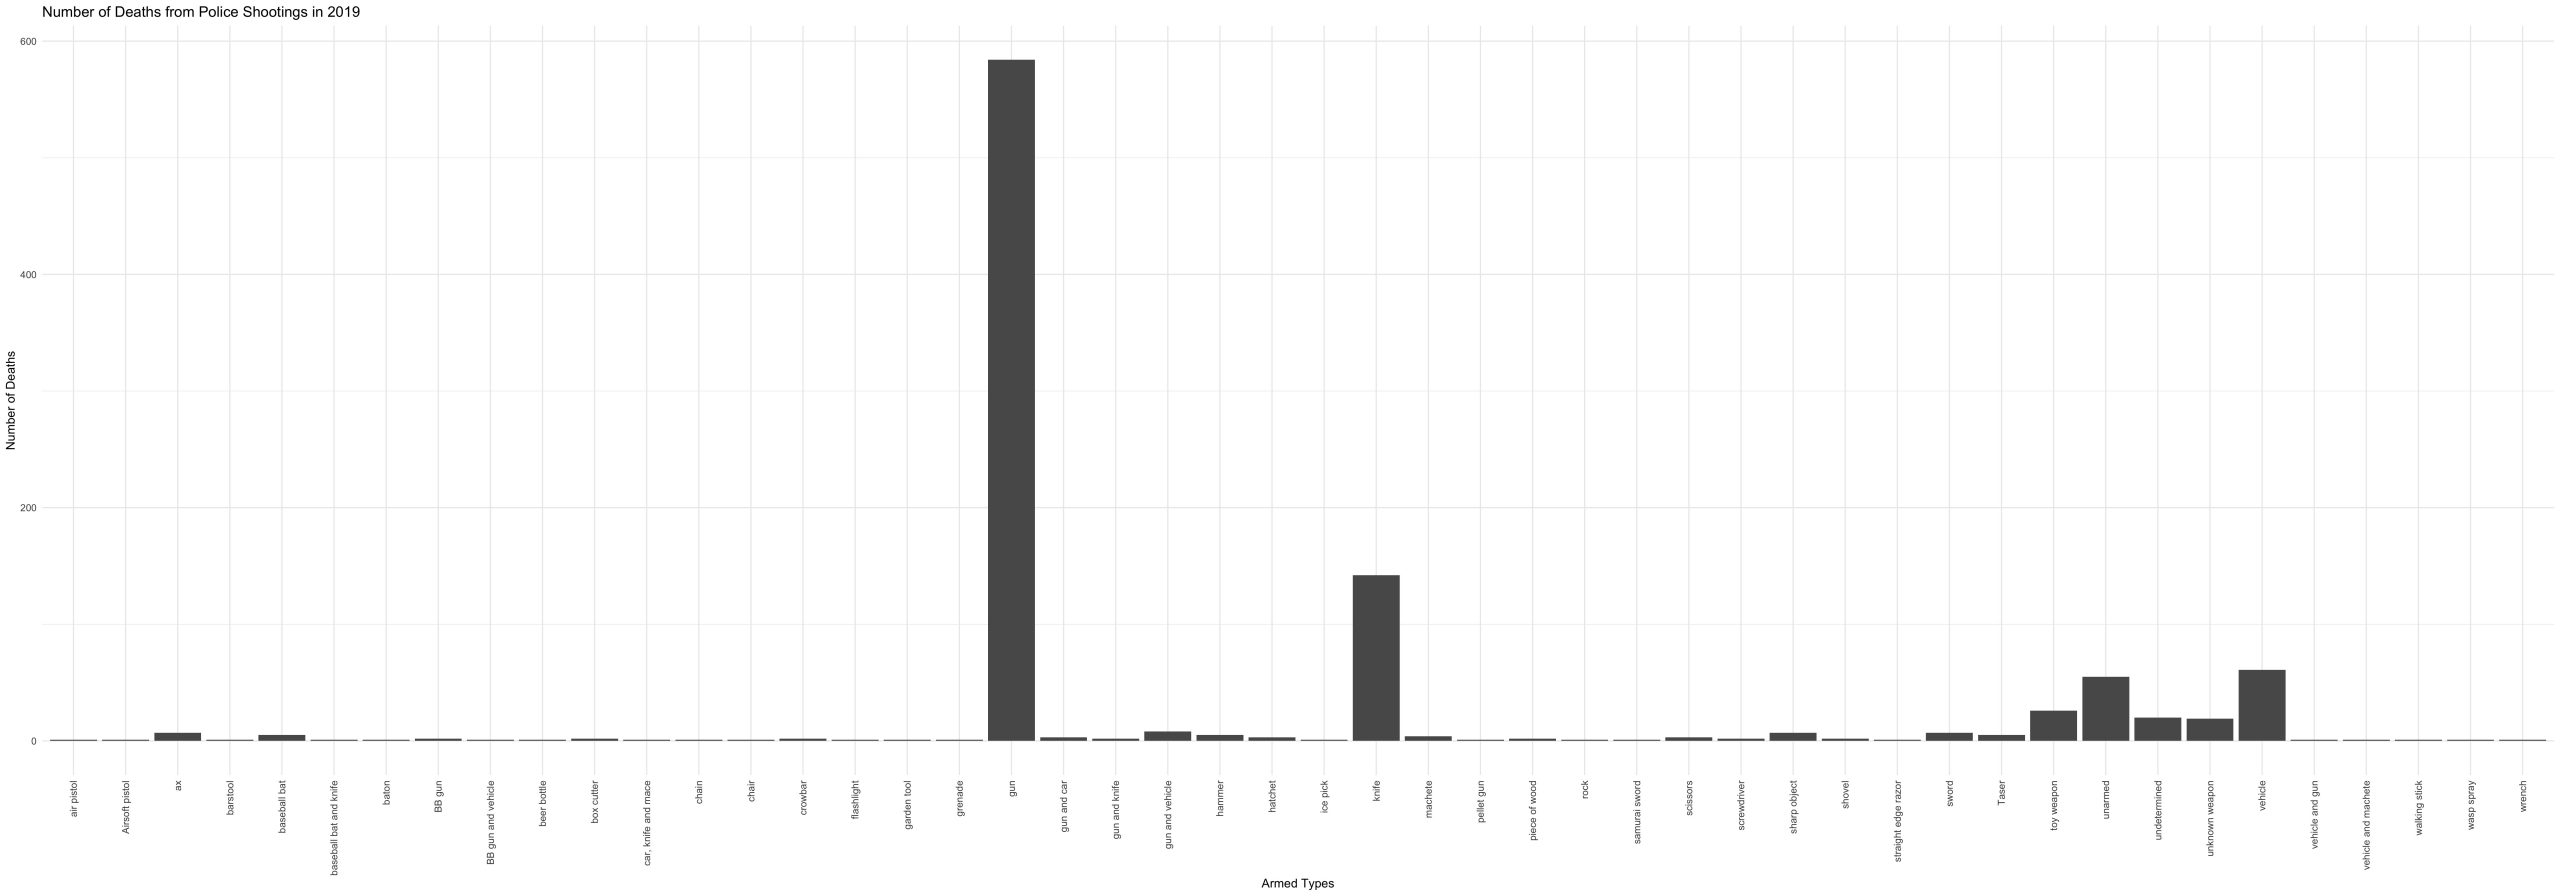
We see a large number of fatalities among people who were armed with guns and knives, but also vehicles and toy weapons. In my opinion cars and toys are not weapons and would more appropriately fit the category of “unarmed.” But what exactly does “unarmed” mean? The basic Google search definition is “not equipped with or carrying weapons.” Okay, well what is a weapon? Another Google search defines weapons as “a thing designed or used for inflicting bodily harm or physical damage.” Toys and cars were not designed for inflicting bodily harm, but may have been used to do so. Now with the same logic, would we call our arms and legs “weapons,” since many people have used their appendages to inflict bodily harm? No. So why do we distinguish the cars and toys from the “unarmed” status?
This breakdown of the categories leads to bias in the data. When categorizing the armed-status of victims of police shootings, the challenge of specificity arises. Some may find value in having more specific descriptions for each of the cases in the dataset, but this comes at the cost of distinguishing certain cases that really should be in the same bucket; in this case, “vehicles” and “toy weapons” should be contained in the “unarmed” bucket, rather than their own separate categories. The exclusion of those cases would provide lower counts to the actual number of unarmed people who were killed by police. Including the cases that involved vehicles and toy weapons brings the count of unarmed fatalities from 55 to 142. In other words, the bias inflicted by granular categorization underestimated the number of unarmed victims of police shootings in 2019.
Now let’s look at the breakdown by race, specifically White versus Black (non-Hispanic).
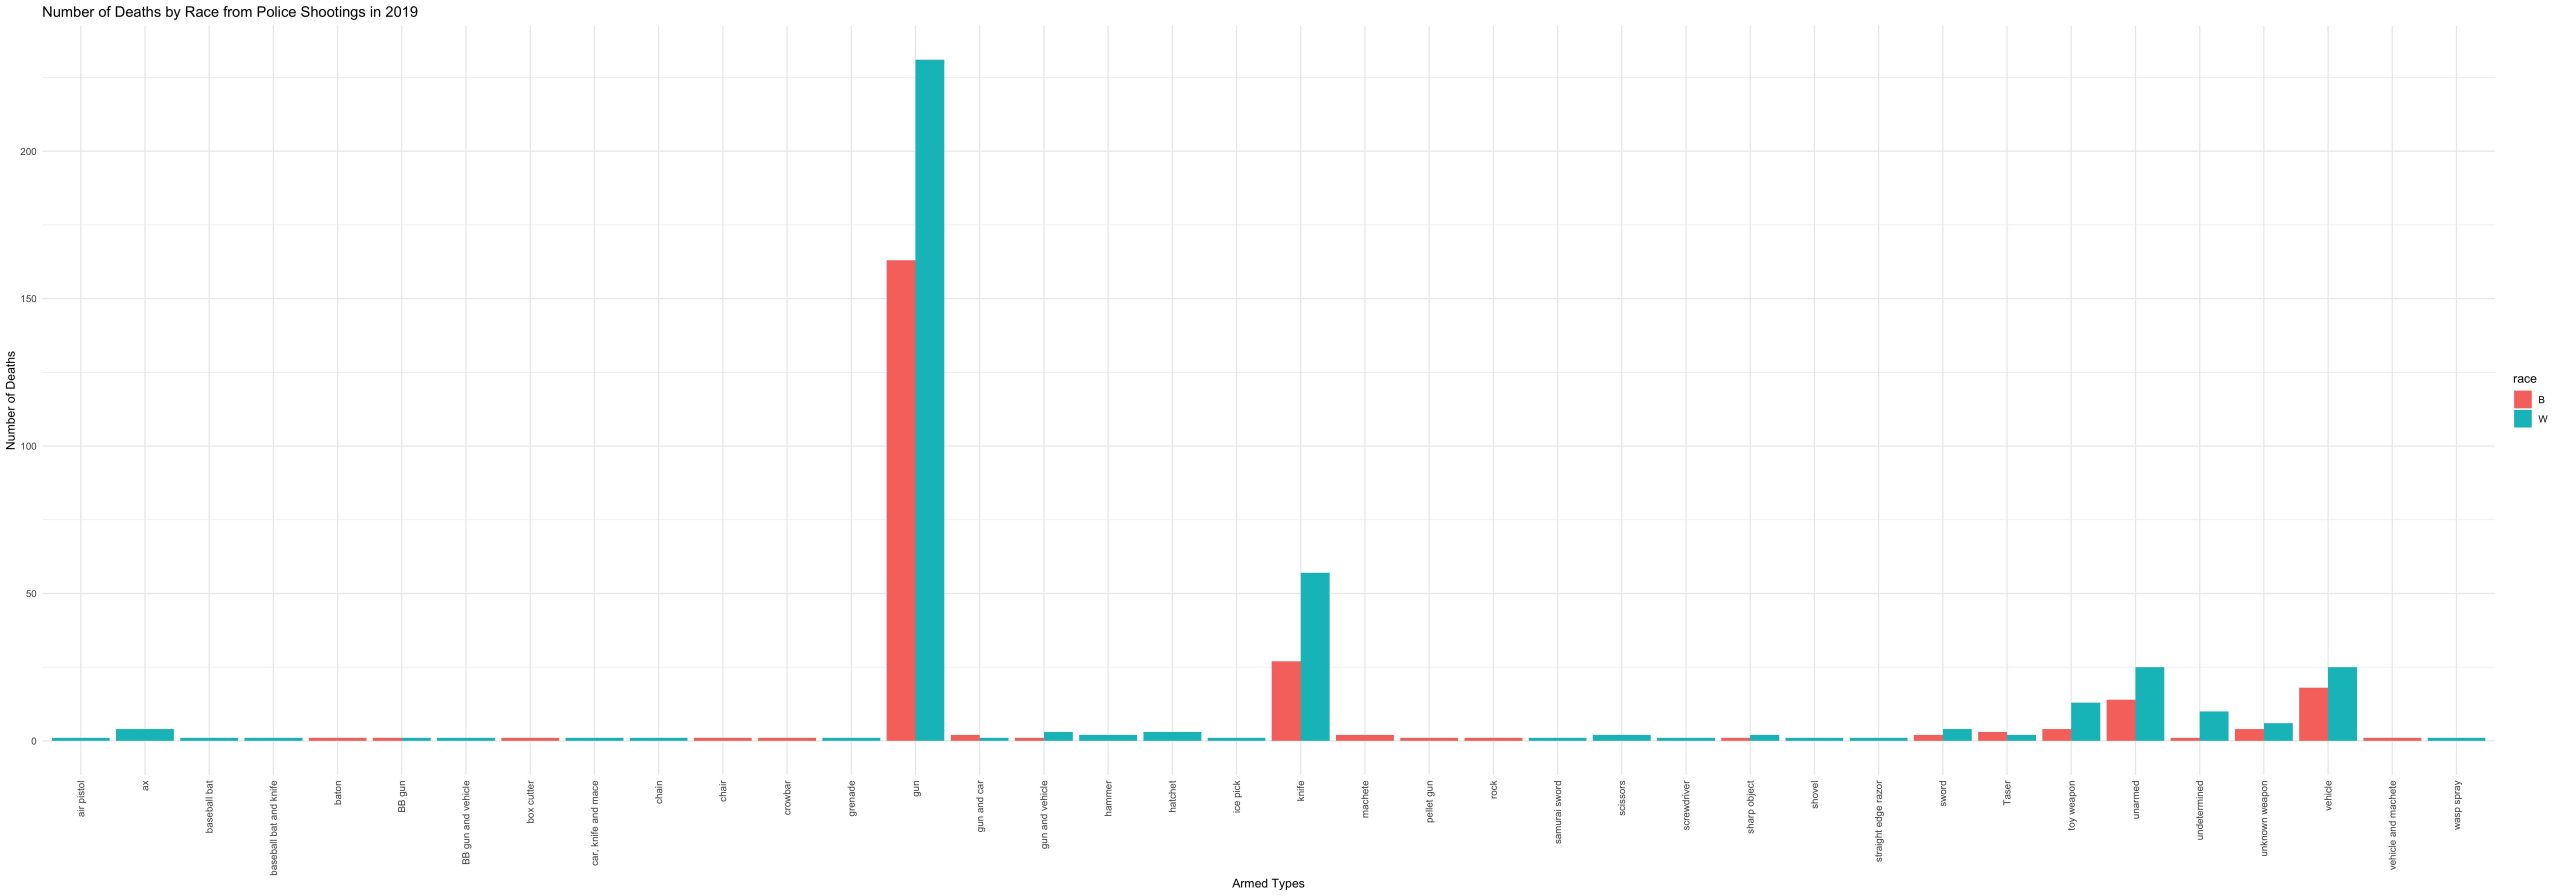
For Washington Post’s definition of unarmed, 45% of the victims were White, while 25% were Black. For toy weapons, 50% were White, and 15% were Black. For vehicles, 41% were White, and 30% were Black. For all of those cases combined, 44% were White, and 25% were Black.
Now some may interpret this as “more White people are being killed by police,” and that is true, but let’s think about the population of White and Black folks in the United States. According to the 2019 U.S. Census Bureau, 60% of the population are White while only 13% are Black or African American. So when we consider, by race, the percentage of unarmed people who were killed by police in comparison with the percentage of people in the U.S., we see a disproportionate effect on Black folks. If the experience of Black and White folks were the same, then we would expect only 13% of police-shooting victims to be Black and 60% to be White. However, we see a much lower number, proportionally for White folks (44% unarmed White victims), and a much higher number for Black folks (25% unarmed Black victims).
This highlights the disproportionate effect of police brutality towards Black folks, yet the point estimates provided from this data may not be fully comprehensive. When police reports are fabricated, when horrific police killings of Black and Brown folks go under the radar, we risk the data provided by the Washington Post to be further biased. However, this bias would suggest an even greater disparity between the victimization by police shootings of unarmed Black and Brown folks. As we consider data in our reflections of current events, we have to be mindful of the potential biases that may exist in the creation and collection of the data, as well as our interpretation of it.