Emoji

Our conversation about Chernoff faces yesterday made me think of emoji (emoticons) and how the visualization of emotion is becoming more important as text-based messaging and interaction grow relative to voice and face-to-face communication. Our faces and voices carry rich emotional information, while our text interactions don’t.

But visualizing emotion is hard. It’s multi-dimensional. And, to me, the somewhat disorderly way companies go about creating emoticons speaks to how hard it is. Popular messaging apps have pages upon pages of emoticons in an attempt to help users add some emotional meat to the cold bones of text.

The iPhone has emoji (you have to enable a special keyboard), and it’s fun to me to think about how Apple designed and ordered them (though they seem primarily designed for a Japanese market).

photo 1

The first page of emoji shows five faces that you could call happy (or contented) followed by an assortment of faces grouped by feature—winking, hearts, kissing, tongue-sticking-out, etc. Then there’s surprise (unpleasant?), teeth-gritting (I think?), a sad face, another random happy face, and a few other sad faces the meaning of which is hard to infer exactly. The second page has a number of other faces, mostly negative in emotion, along with the all-important face mask emoji:

photo 2

It’s not a super coherent representation of our various possible emotions, but perhaps it’s “good enough” or suits our culture (or, rather, the Japanese culture) well. What would be a better or more complete representation? Maybe a few icons at least per “basic emotion”? Arranged by intensity? (i.e. neutral smiley to really smiley smiley, or neutral smiley to anxious smiley, or…you get the picture). It’s interesting to ponder.

Facebook is clearly pondering this—check out the new experimental feature that lets you set a mood for your status update. A few Facebook researchers also at a recent public presentation said they worked with an animator at Pixar to experiment with some new emoticons, using Darwin’s emotions as a basis. I thought some of them were fun:
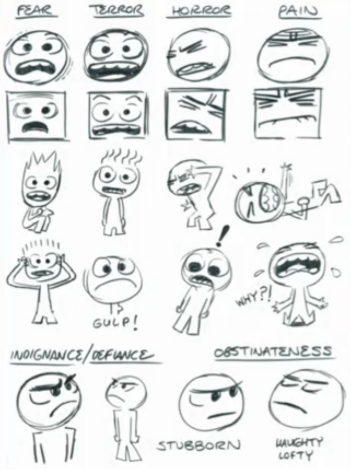
Screen Shot 2013-02-05 at 11.06.46 PM


-Galen 😛

Parallel Coordinates

Unfortunately I wasn’t able to show you the Parallel Coordinates example in class. Parallel Coordinates are a great technique to explore relationship between (seemingly) unrelated dimensions of multivariate data set.

Take a look at http://exposedata.com/parallel, which was made by Kai Chang, who’s local to the SF Bay Area. Take a second to familiarize yourself with the user interface. You’re able to re-group the parallel axes to better explore different relationship of adjacent dimensions. You can also filter out parts of each axis, which reduces the number of lines drawn.

If you would like more information, here is a good blog post on parallel coordinates. On a related note, Robert Kosara’s blog eagereyes.org is one of the best blogs that takes information visualization seriously without appearing too academic.

Readings for Tuesday

Just a heads-up to note that readings were posted for next week’s lecture. Tuesday 1/29 your Assignment 1s are due, then the following Tuesday 2/5 your first days of data for Assignment 4 are due. Probably a good idea to invest a little creative energy this weekend thinking about the kind of data you want to collect every day.

Some inspiration:

Tableau

As promised, here is some information about Tableau:

[unordered_list style=”tick”]

  • Download Tableau 7.0 from: http://www.tableausoftware.com/tft/activation
  • On the landing page you’ll get to at the link above, fill out the form on the right hand side of the page. Under “Job Title”, mark Student; and under “Organization”, please input “UC Berkeley School of Information”.
  • License Key: [highlight]Check your email[/highlight]

[/unordered_list]

You need to run Windows in order to use Tableau. If you own a Mac, you can you can get all the software needed to do this for free:

[unordered_list style=”tick”]

[/unordered_list]

In case you run into issues with your installation, [highlight]don’t hesitate to add a comment to this post[/highlight] so that anyone can help you out.

Lab 1 – Data: Preparations

To make sure we’re not wasting time installing applications during the lecture, please come prepared to the lab and install the following application:
[unordered_list style=”tick”]

  • Open Refine (formerly known as Google Refine)
    If you work on a Mac with Mountain Lion and run into problems installing the app, the culprit is most likely the download restriction for apps from unknown developers. To run Google Refine you’ll have to temporarily disable the privacy protection (as described in this issue ticket).

[/unordered_list]
We’re also going to use the Google Spreadsheet app (part of Google Drive). In the unlikely case you haven’t already signed up for a Google account, please make sure you do so before the lecture.

If you run into any other problems installing the applications, please comment on this post so that others can avoid going through the same issues.

Class Mailing List

If you haven’t already, please sign up for the class mailing list:

I School Students

If you’re an I School student: subscribe via email to Majordomo by sending email to Majordomo@ischool.berkeley.edu with the following command in the body of your email message:

subscribe i247

Make sure to use your I School email. Alternatively you can subscribe via you intranet account (https://www.ischool.berkeley.edu/intranet/prefs/lists)

Students From Other Departments

If you’re a student from another department: send an email to Galen (gpanger@ischool) and he’s going to add you to the list.

Starting next week (that is, after the next class session) the mailing list is going to be where we send out reminders and announcements.