This week was one of travesty in the city of Boston. As you all are aware of, there was a bombing at the Boston Marathon. Three people died on that tragic day.
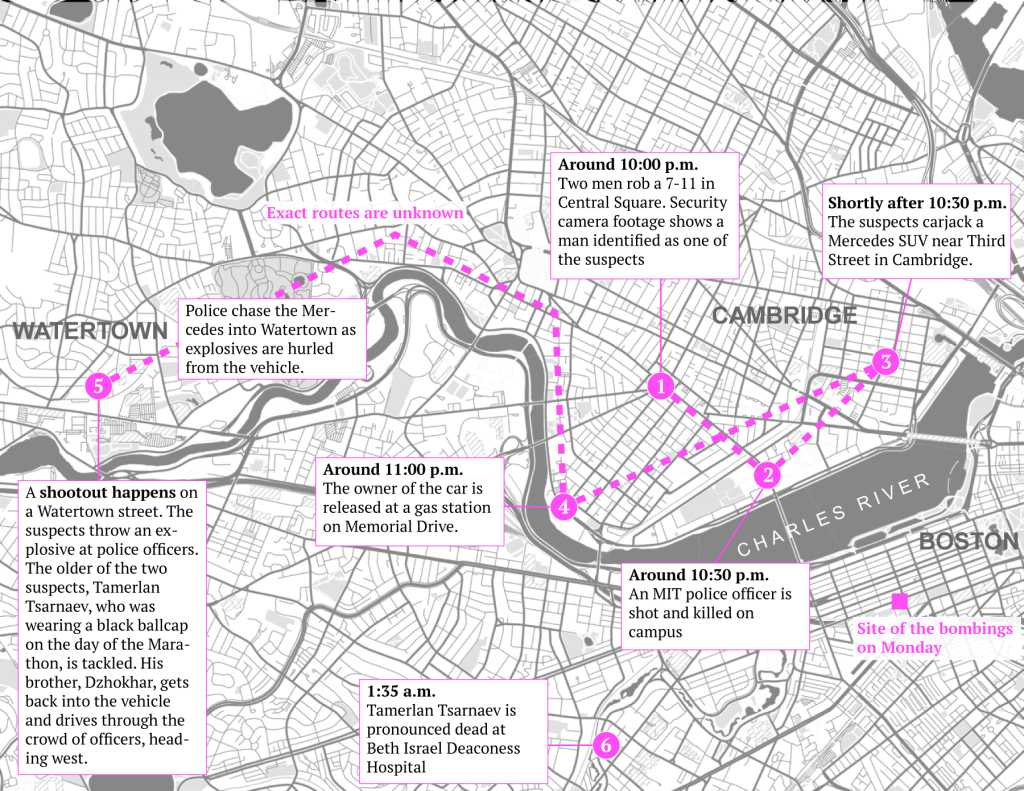
The above visual is from one of my favorite news websites, QZ.com. The visual maps out the sequence of events that unfolded on the city’s streets throughout the day. I think this is a superb visual because it clearly answers the following questions: What happened? Where did it happen? When did it happen? From the beginning to end, there’s complete clarity in the author’s narrative.
I honestly cannot offer substantive criticisms regarding this visual (I’d make different color choices, but I don’t think that is all important here because I got the information I needed). The folks at QZ.com just have knack for developing great visuals and delivering news content in a concise manner (usually 2-4 paragraphs).
-Sonny V.
Source: http://qz.com/76298/how-the-manhunt-for-boston-marathon-bombing-suspects-unfolded/