Goal
You’ll create an interactive information visualization using the tools, frameworks, and theories from this semester. You may use any data set not used in a previous assignment, and any tools, provided the final visualization may be viewed in a browser. We recommend D3. Static visualizations are only accepted if there is a strong rationale not to use interaction.
Your visualization should be a focused effort that is attentive to the concepts and strategies covered in the course. Be creative and push yourselves to consider a number of concepts before settling on one. When you settle on a concept, be focused and have an objective. Think about your audience, create a narrative, and apply a level of visual polish.
Deliverables
Your main final deliverable is a [highlight]hosted version of your final visualization artifact[/highlight] and [highlight]your source code[/highlight]. You’re also required to [highlight]hand in a 1,500-2,000 word report[/highlight] that covers your final visualization and the important parts of your process, and [highlight]post an entry to the blog[/highlight] about your final project. And finally, you’ll [highlight]give a 12-15 minute presentation[/highlight] to the class and invited attendees.
In addition to covering the parts of your process that you think are important to highlight, please also ensure your report includes the following things:
[ordered_list style=”decimal”]
- Competitive Analysis. Who has done similar things? Did you learn anything from these visualizations? What could be improved?
- Sketches and Iteration Artifacts. Show how your visualization has evolved from early concept sketches to important iterations to your final version. Discuss your decision making.
- Feedback. What did you learn and incorporate from the critiques of your work by your peers, in lab or elsewhere?
- Division of Labor. What did each member of the team contribute to the project? What was the team dynamic?
- Most Important Step. What would you describe as the most important part of your team’s process in creating your visualization?
Blog posts should include 1-3 screenshots of your visualization, no more than four paragraphs describing your visualization, and a link to the hosted version. Take care to set a featured image that looks attractive on the homepage, and use a compelling title. In your 12-15 minute presentation, be visual and, as always, tell a story. Leave some time for Q&A, too.[/ordered_list]
Teams
You will work in group sizes of 3-4 people. While we encourage everyone on the team to contribute to each aspect of the project, we’ve seen the best results with teams where group members have complementary skill sets or were willing to develop complementary skill sets for the project, i.e. coding, graphic design/aesthetics, concept/research/writing, etc.
Pitfalls
Schedule
| Apr 4 | Project proposals due (submit 1-2 pages: team, topic, data, 2 competitive examples, as PDF) |
| Apr 11 | Lab: Concept critique |
| Apr 25 | Lab: Design critique |
| May 5 | Deadline for deliverables (submit source code and writeup as zip, links to hosted visualization and blog post) |
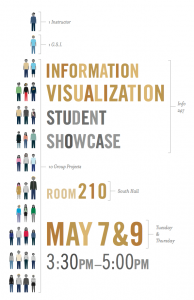
| May 7 & 9 | Final Project presentations (submit PPT or Keynote by [highlight]noon[/highlight] on your presentation day, see schedule) |
Grading
| 15% | Perceptive attributes, layout and aesthetics |
| 15% | Effective representation/encoding of data |
| 15% | Storytelling and use of interaction |
| 15% | Process, concept sketches and iterations |
| 15% | Overall quality of concept and effort |
| 25% | Writeup, presentation and blog post |
Submission
Make all submissions to gpanger@ischool. For your slides, please send PPT or Keynote. For everything else, send PDFs or browser-viewable files. No .docs, .ais, etc. [highlight]The final project submission is due by Sunday, May 5th at 11:59 p.m.[/highlight] No exceptions, no extensions!
