
In this first assignment, you will [highlight]find, select, and document two information visualizations[/highlight]:
[ordered_list style=”decimal”]
- One visualization should be found from an online resource. This visualization should be one you like and about which you want to learn more.
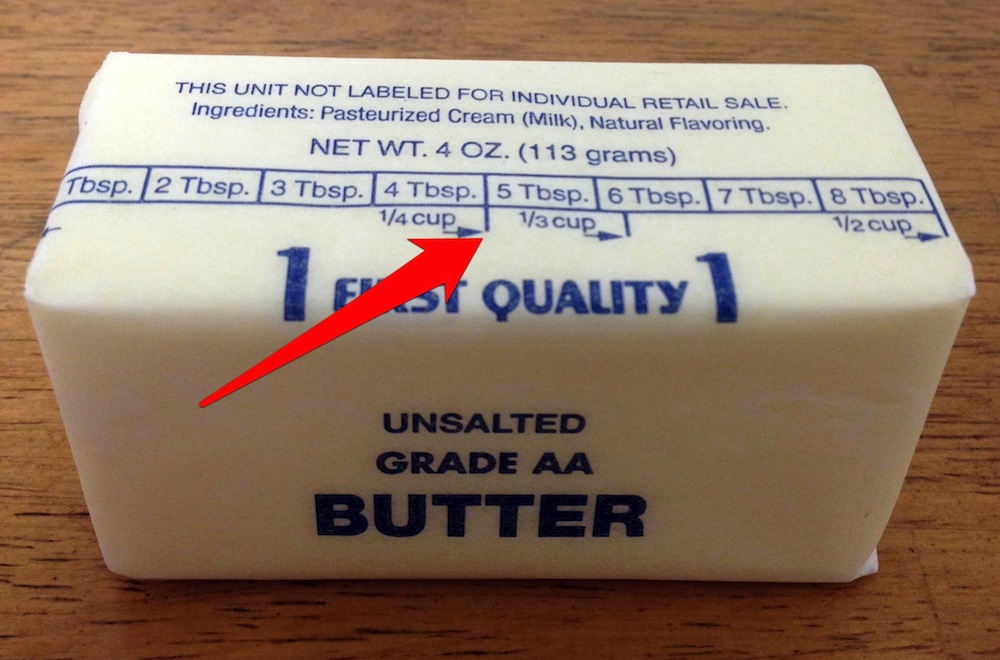
- The second visualization should be found “in the wild” (i.e. not online or in newspapers or magazines). You will find data visualizations in the most unexpected places. Think restaurant menus, billboards, or kitchen utensils. Be creative. The following is a perfectly fine example of an information visualization in the wild:
[/ordered_list]
Deliverable
For both visualizations, take a photo or screenshot and add a paragraph or two containing:
[unordered_list style=”bullet”]
- where you found it
- what its intended function is (Analyze? Communicate? Record?)
- more specifically, what you think is the author’s main objective.
[/unordered_list]
Goal
The goal with this assignment is that you start thinking about objectives when creating or critiquing information visualizations. What is more, I want you to think about where visualizations can be used beyond what they are used for today.
Grading
This assignment is going to be graded on a check/check+/fail basis.
Deadline
[highlight]Due Tuesday Jan 29, 3:00PM[/highlight], as a PDF by email to gpanger@ischool.