
Our objective was to create a fun way for users to explore beer varieties. The data set was taken from BeerAdvocate (http://snap.stanford.edu/data/web-BeerAdvocate.html), a comprehensive collection of 10 years worth of user reviews on beer.
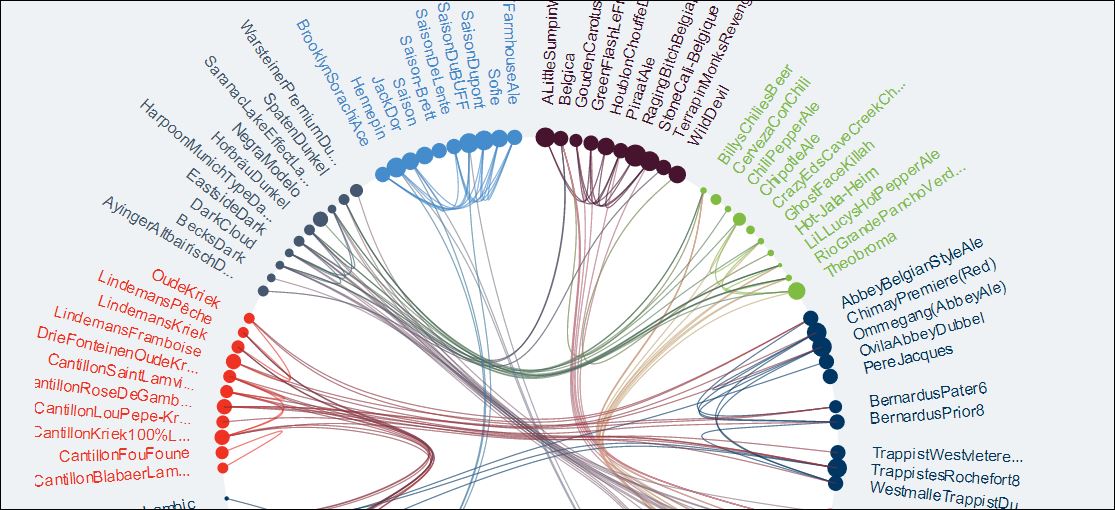
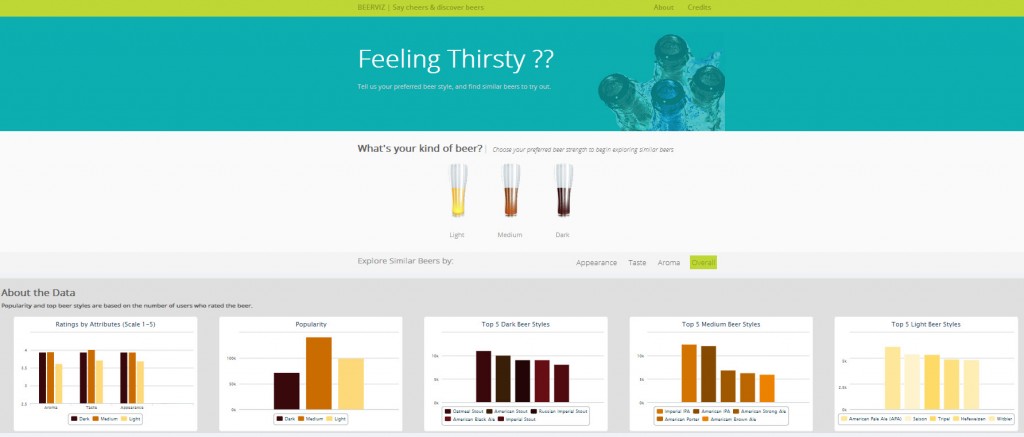
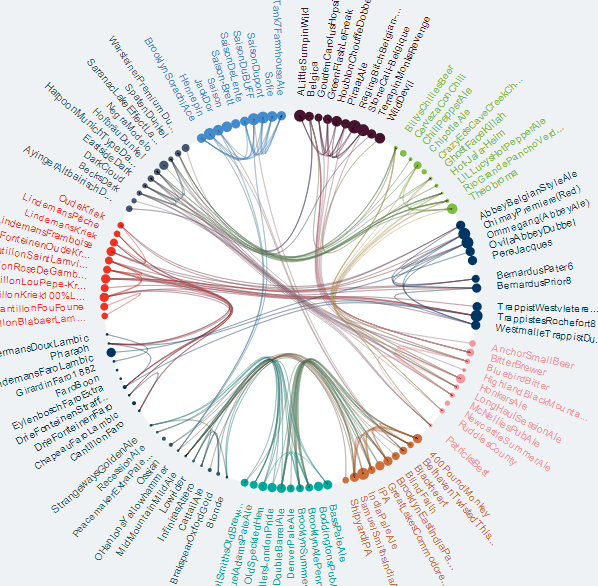
We wanted to ensure that the multi-dimensionality of our data was showcased through our visualization and so we opted to create a chord layout. The narrative begins by asking users to select their preferred beer strength, and uses this input to generate a chord that showcases similarities between beers based on reviewer ratings. Users can further explore similarities across the parameters of appearance, taste, aroma and overall ratings. These similarities are depicted by connected chords. Beerviz shows you the most reviewed types of beer and allows you the explore the relationships between them. Additionally, the size of the nodes represent the popularity (defined by number of user reviews) of the beer that they represent. Hovering over a node highlights the relationships. Beers are clustered based on the styles. These styles are represented with various colors.
Once a user has explored and discovered beers he wants to try, he can also look at the summary charts that provide a summary of the entire dataset. Our summary charts showcase the following key statistics:
- Average ratings for each of the parameters (aroma, taste and appearance) by type of beer (depicted by the beer colors).
- Popularity of the various kinds of beer based on the number of reviews
- The top 5 beer styles for dark, medium and light beers
From our own explorations of the visualization we have found some interesting beers like Raging Bitch, Old Rasputin Russian Imperial Stout and Hopstoopid that we plan to try out. We hope that users enjoy using our visualization to explore and discover beer.
Here is a link to our visualizations: http://seekshreyas.github.io/beerviz/#
Team: Divya Anand, Evie Phan, Sonali Sharma, Shreyas