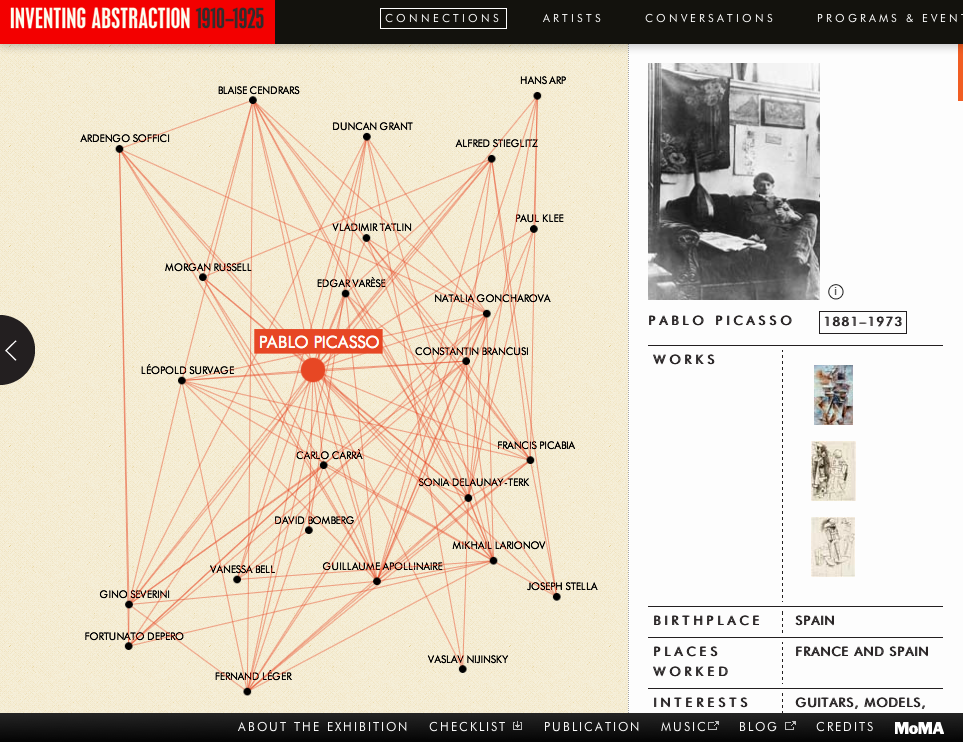
I always find me confused with all the foreign names of the artists and their artwork and mutual influence to others in their work in art. I found this interactive visualization from MoMA as tool to help people want to know more about the art.
http://www.moma.org/interactives/exhibitions/2012/inventingabstraction/?page=connections
It is an exploratory visualization of graph of the abstractionism artists and their representative artwork with brief history. An art movement can’t be understood with only one artist but with a group of artists and its historical context. In this sense, this visualization is giving a chance to expand their understanding to a larger pool of artists by comparing their style and the influence they’ve exchanged.
I personally think this visualization could be a lot more interactive and educational. If a snippet of work of the artist would pop up it must have been easier to match the his/her name and the work. Also, in the graph, if there was some weight difference to show who interact with whom more often, it would have been great and fun to compare their artwork.

