
Team: Evie Phan, Aksel Olsen, Jacob Portnoff, Aude Hofleitner, Divya Anand
We toyed with several iterations on the increasing disparities in income and taxation levels during the past 30 years, but it doesn’t seem to us that the main source of rising inequality was the rising wealth of the top 1 percent per se. We liked the chart showing how average salaries since 1970 had been relatively stagnant while productivity had grown substantially. The wealth of Americans, it seemed, had become unhitched from the great successes of corporate America during the past few decades of globalization.
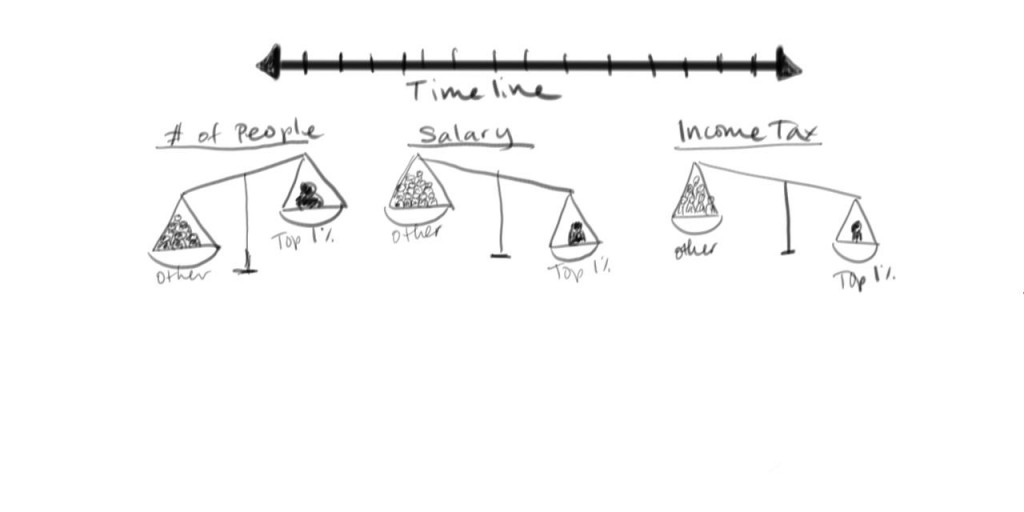
With this as a point of departure, we came up with the scale as a succinct metaphor for the divergence of economic fortunes. The idea is to split the population in two groups; the 99 percent (other) and the 1 percent (wealthy) and show a scale balancing different economic distributions. The first one would just compare count of people; the second the income share to each “group”, the third the share of taxes. For each variable, the scales would
balance in different ways. To be fair, we would include the share of the federal income tax which would tip the scale in the other direction, as the top 1 percent paid a full 28% of the Federal
Tax Liabilities for All Households.
We would implement this as an interactive visualization with two variable features:
(1) a time slider, allowing the user to see change over time, and
(2) an equalizer, allowing the user to see how the two groups would need to change in size to give an equal balance
On the right hand side, we would have linked decorations/charts, enhancing the main core of the story though additional and relevant details.
The target audience is the general public.