
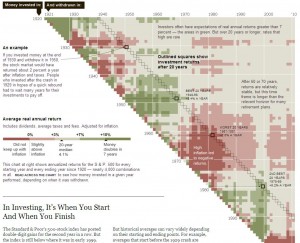
I found this visualization in the business section of The New York Times’ website. It accompanied the article “In Investing, It’s When You Start and When You Finish.” In this article, the author finds that ordinary investors expect average of 7% return on their investments when they invest over a long period of time – 10 to 20 years. However, the historical data do not support this conventional wisdom and the author demonstrates that stock market returns on investments vary widely depending on starting and ending points of individual investments. He chooses this graphic to analyze and communicate the historical evidence in support of his claim that market returns are more volatile than most people realize, even over longer periods of time.
Besides providing clear annotations, this heat map displays two quantitative dimensions – average real annual returns and time periods measured in years to illustrate that returns on 20-year investments can vary depending on when money was first invested and when it was withdrawn. It allows easy comparisons of various investment timeframe combinations. The reader can easily see that long-term investments done from mid-1960’s through mid-1970’s could hardly keep up with inflation. In contrast, short-term investments made in 1980’s and late 1990’s produced more than 10% returns. When following a typical 20-year investment line, it is obvious that 20 years is not the magic number and the returns vary from not keeping up with the inflation to 7-10% returns.
I like this graphic because it does a good job organizing and presenting a great deal of quantitative information and supporting author’s claims. It uses colors that are intuitive for readers to interpret (shades of red – loss or low returns; shades of green – 3%+ returns). It also provides enough context through legend, annotations, and 20-year return example that makes it very easy to read and interpret.
http://www.nytimes.com/interactive/2011/01/02/business/20110102-metrics-graphic.html
Julia K-C